

How Satellites and Machine Learning Are Changing USDA Crop Estimates

Crop estimates are forecasts of how much of a crop will be produced. They are based mainly on two factors: how many acres are expected to be harvested and how much crop is expected to be produced per acre.
The U.S. Department of Agriculture’s National Agricultural Statistics Service, or NASS, develops these estimates using farmer surveys, field observations, and other data. The forecasts help farmers, grain handlers, processors, exporters, lenders, insurers, researchers, and policymakers make decisions about production, marketing, and risk.
USDA publishes crop forecasts before harvest is complete so markets and agricultural businesses have useful information while the growing season is still underway. As conditions change, USDA updates its estimates with new information.
How USDA Estimates Crops Today
NASS estimates crop production by combining information from farmers with measurements taken in selected fields.
One important source is the Agricultural Yield Survey. Selected farmers report how many acres they planted or expect to harvest and how much they expect each acre to produce. NASS uses statistical sampling, meaning a relatively small group of farms is carefully selected to represent a much larger farming population.
For selected major crops, USDA also conducts Objective Yield Surveys. Trained field workers visit sampled fields, count plants and crop features such as ears or pods, and measure crop development. Later, they collect samples to determine weight and moisture.
NASS combines this information with acreage estimates to forecast yield and total production. The same farmers and field plots are revisited during the growing season, allowing USDA to update forecasts as crop conditions and harvest expectations change. Updated forecasts are published in the monthly Crop Production report.
Limitations of Current Methods
Farmer surveys and field measurements provide valuable information, but they cannot cover every farm or field. Because NASS relies on carefully selected samples rather than the entire farming population, its estimates include some sampling uncertainty.
Crop conditions can also change between observations. Heat, drought, storms, pests, or rainfall may affect yields after a survey or field visit. USDA responds by revisiting sampled farms and plots and updating forecasts throughout the season.
These limits create room for technologies that can provide additional information across much larger areas.
Satellites and Crop Monitoring
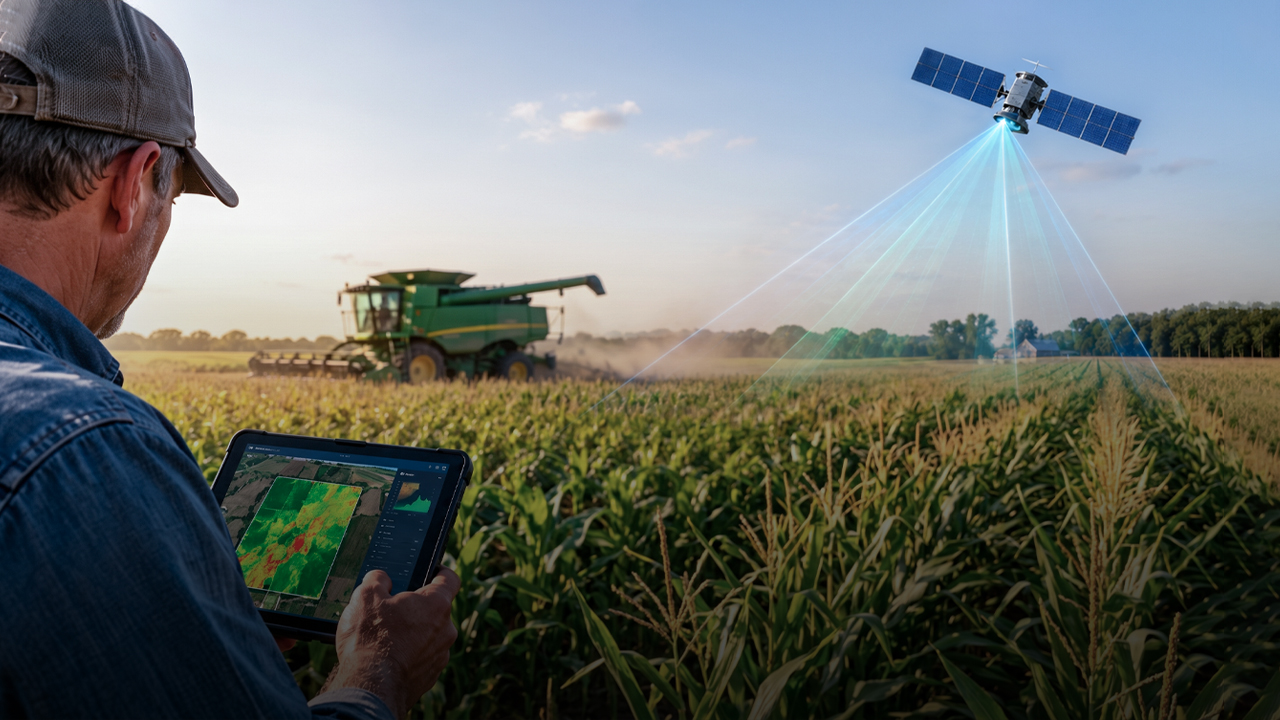
Satellite imagery can provide a wider view of agricultural areas. Satellites collect repeated images during the growing season, making it possible to observe crop conditions across large regions and over time.
The images can show differences in crop growth, moisture, and signs of stress caused by weather or other conditions. This makes satellite data a useful addition to traditional surveys and field measurements.
USDA already uses satellite imagery to help estimate planted acreage, map where different crops are grown, and monitor vegetation conditions. This means the shift toward satellite-based agricultural monitoring has already begun. However, satellite images alone cannot explain why conditions are changing or determine what final yields will be.
Where Machine Learning Fits In
Satellites can collect large amounts of information, but that information still has to be interpreted. Machine learning can help by finding patterns and relationships across different kinds of data.
For crop research, this can include satellite observations, weather, historical yields, crop type, soil information, and field measurements.
USDA already uses automated classification methods with satellite imagery and ground-reference data to create the Cropland Data Layer, which maps crops across the United States. This is a current use of satellite data and automated analysis, but it is separate from USDA’s main survey-based yield forecasting process.
Researchers are also testing machine-learning models that combine remote sensing, weather, soil information, and measured yields. These approaches are still being studied to determine how reliably they could support crop monitoring and yield prediction in the future.
How Crop Estimation Is Changing
The change is already underway, but it is still developing. USDA already uses satellite imagery and automated analysis for crop mapping and monitoring, while researchers continue to study how these tools could play a larger role in crop-yield forecasting.
Satellites can provide frequent observations across large farming areas, while machine-learning models can compare those observations with weather patterns, historical yields, and crop information. If these methods prove reliable, they could help identify crop stress earlier, update forecasts more frequently, or produce more detailed estimates for different regions.
Even with these tools, information collected on the ground would remain important. Farmer reports and field measurements could confirm what satellites detect, provide details that imagery cannot capture, and help keep forecasts accurate.
Conclusion
USDA currently bases crop forecasts largely on farmer surveys, statistical methods, and field measurements. At the same time, satellite imagery and automated analysis are already being used to improve crop mapping and monitoring.
Researchers are now exploring how machine learning and remote sensing could be used more directly in yield forecasting. Rather than replacing traditional methods, these technologies are more likely to work alongside farmer reports and field measurements, giving USDA broader and more frequent information about crop conditions.